Clinical Multi-Omics Data Correction – Sentieon Awarded Machine Learning…
Background and Results of the Challenge
Starting in September 2018, precisionFDA, a cutting-edge exploration platform in the field of precision medicine in the United States, organized a medical multi-omics data challenge, inviting teams from around the world to submit solutions. Participating teams needed to perform joint analysis of transcriptomics, proteomics, and clinical phenotype data, use machine learning to model the data, and find and correct mislabeled sample labels.
The detailed background of the challenge, the specific settings of the training and testing sets, and Sentieon’s championship performance have been described in previous reports and will not be repeated here. For more information, please click “RECOMB News: Sentieon Wins the precisionFDA Multi-Omics Data Challenge.”
In recent years, with the vigorous development of big data in the field of biomedical research, the industry generally expects that AI-assisted systems will be applied in various subdivisions. However, it is undeniable that currently, the more popular applications are still limited to assisted image interpretation or assisted diagnosis based on natural language processing. There are few mature applications for multi-omics joint analysis, which is a direction of big data. One reason is that various technical routes in the industry are uneven, and there is a lack of a credible platform to evaluate and discuss different methods. We are pleased to see that precisionFDA has organized this challenge in a timely manner to identify outstanding methods and teams and share them with the industry.
After the challenge, the organizer, precisionFDA, invited the top three teams to discuss and further test their machine learning algorithms. After integrating the strengths of each team, an open-source software solution called “COSMO” was launched for sample label correction of multi-omics data. This provides the possibility for the correction of clinical trial data for pharmaceutical companies. We know that in the current era of precision medicine, one of the main purposes of clinical trials is to use multi-omics data to find biomarkers for trial patients to predict clinical phenotypes and drug efficacy. However, some quality control studies have shown that about 5% of samples are assigned incorrect sample labels due to human error, which reduces the credibility of clinical trial results. We believe that COSMO can quickly and automatically assist users in sample quality control, and has great value in accelerating drug development.
The strength of the Sentieon team lies in the development of core algorithms for bioinformatics software and machine learning modeling. In this multi-omics challenge, we demonstrated our experience in handling big biological data and machine learning methods. We are willing to cooperate with clinical diagnostic companies and pharmaceutical research and development enterprises in the industry to explore customized data processing solutions and help users more accurately use multi-omics data to solve clinical problems!
Sentieon team methods
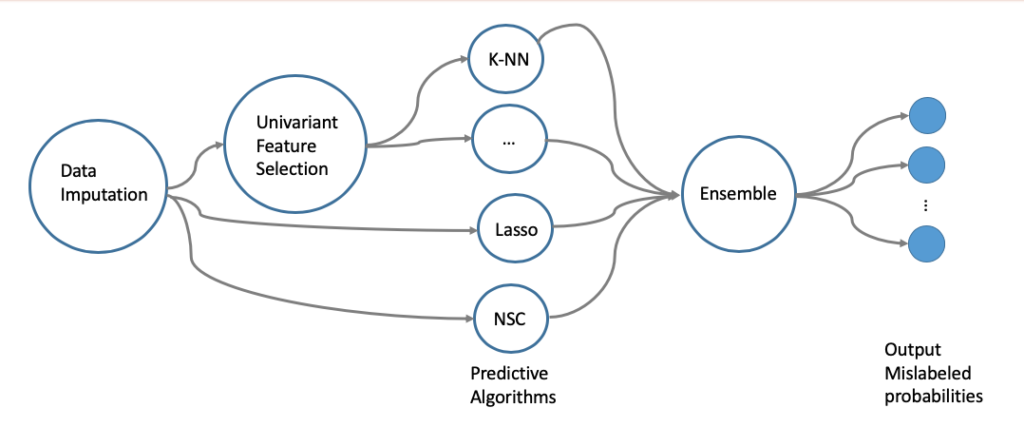
Quantitative omics data, represented by transcriptomics and proteomics, are typical multidimensional data types with low sample size compared to the number of dimensions. Before proceeding to subsequent processing and matching with clinical phenotypes, some data preprocessing is required, including standardization correction, missing data filling, and feature selection. To address these challenges, each team has proposed their own creative solutions. In this article, we will focus on the Sentieon team’s method, based on a recent publication.
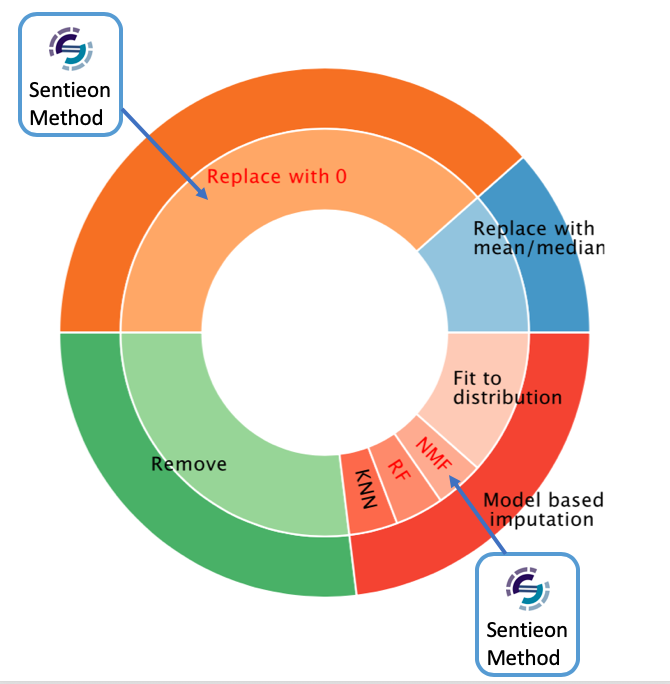
When analyzing proteomic data, we found that over 30% of genes had more than 20% missing data in samples. To fill these blanks, we used two types of imputation methods depending on the gene type: Missing At Random (MAR) and Missing Not At Random (MNAR). For example, for Y chromosome genes in female samples, we considered this as MNAR, with no detectable protein expression levels, and we assigned a value of 0 directly to these sites. For MAR, our strategy was to use the Non-negative Matrix Factorization (NMF) method to infer and fill in missing values by analyzing other data.
Feature selection
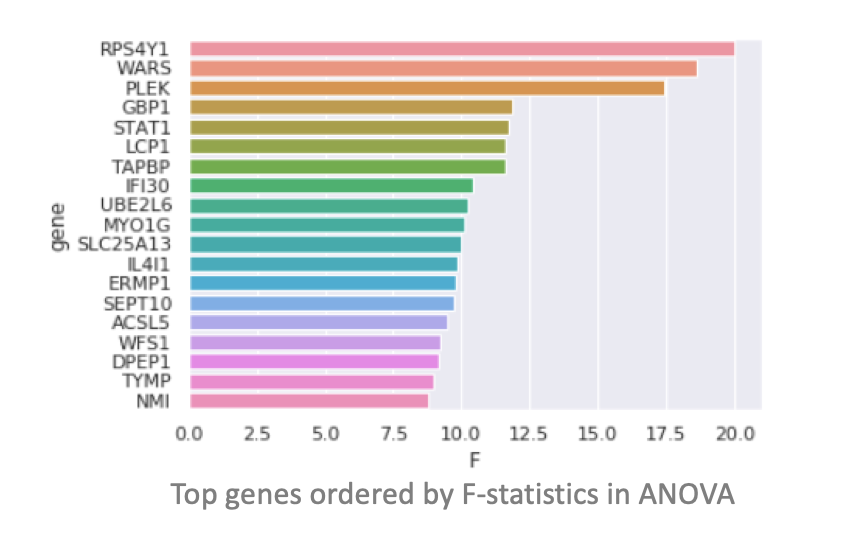
High-dimensional and low-sample-size are typical characteristics of omics data. To effectively reduce dimensionality, we adopted multiple dimensionality reduction strategies, including Univariate Feature Screening and Regularized Model Fitting. Specifically, in Univariate Screening, we used One-way Analysis of Variance (ANOVA) method to calculate the differential expression significance of genes across different clinical phenotype groups. We then corrected the P-value thresholds for different testing scenarios using Bonferroni Correction and Benjamini-Hochberg Process, and integrated the selected features (gene sets) from different scenarios into the modeling process. On the other hand, in the Regularized Model strategy, we used L1 Regularized classifiers such as LASSO and Nearest Shrunken Centroid (NSC) to automatically select gene sets during the modeling process. Finally, we selected hyper-parameters of the machine learning models through cross-validation and obtained gene sets that could predict two clinical phenotypes, microsatellite instability (MSI) and sex.

Sample matching for proteomics and clinical phenotypes
In the previous step of feature selection, we used LASSO, NSC, and k-Nearest Neighbors (k-NN) methods to predict clinical phenotypes. Since sample mislabeling is less likely to occur, we suggest taking into account the weights of different labels and using a Label-Weighted k-NN classifier to match the error rate given in the training set. It is also worth considering that for two clinical labels (gender and MSI), there are two label classifier strategies that can be used: one is to predict the probabilities of gender and MSI separately and then merge them; the other is to directly separate them into four types and predict them separately. In the final step, the prediction algorithms generated by different strategies are integrated to generate the final clinical phenotype prediction model.
Matching of proteome and transcriptome
In the training set, we established a regression model and calculated the Goodness-of-fit using R-squared to measure the correlation between the abundance of each gene in the proteome and transcriptome of each sample. Then, we constructed a gene set with high correlation for further analysis. To reduce model noise, we performed random sampling from the gene set and iterated multiple times, strengthening the stability of the matching model. Next, for N samples, we defined an NxN distance matrix to represent the distance between each protein sample and all RNA samples. This distance can be either the distance between the numerical values of the expression levels converted by a linear model, or the distance based on the expression level ranking of the same gene in different samples. This definition transforms the sample matching problem into finding the sample pair with the shortest distance. Based on the results, both methods of defining distance can perfectly correct mislabeled samples.
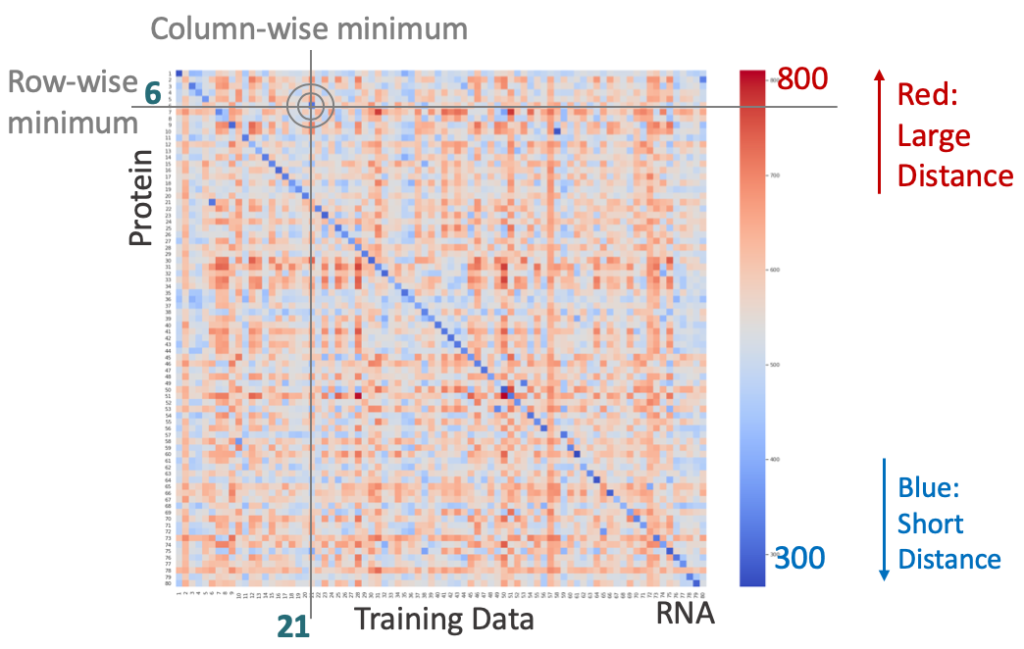
Distance matrix between transcriptome and proteome of training set, with correct samples showing the shortest distance on the diagonal and mislabeled samples off the diagonal, with a gray bullseye representing an example of mislabeled sample.
Joint development of multi-omics error correction software COSMO
Software workflow
As a major highlight of this challenge, the top three teams collaborated under the coordination of precisionFDA organizers to develop a software named COSMO that can automatically process multi-omics clinical samples and correct sample labels. The COSMO software includes the following four steps: data preprocessing, sample omics data pairing, clinical phenotype prediction, and sample label correction. Each step integrates the winning methods validated in the challenge to achieve the best results. Finally, the COSMO workflow is compiled into an open-source software in the Nextflow and Docker frameworks for users to download and use.

Real Data Validation
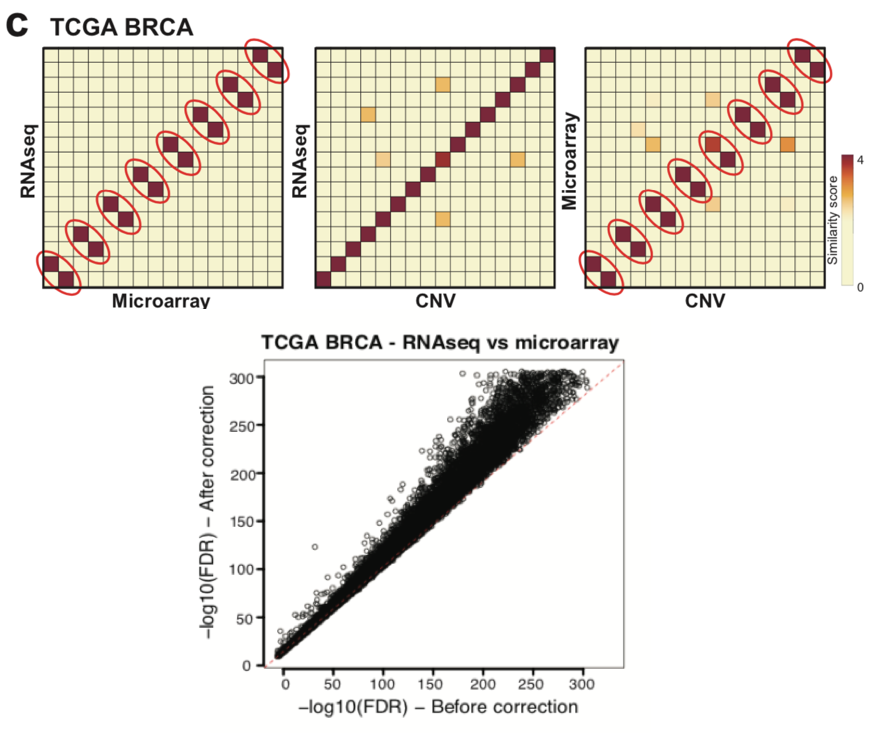
To validate the accuracy of COSMO’s error correction, the development team tested it on a series of simulated and real datasets. One example is the TCGA BRCA breast cancer dataset consisting of 521 tumor samples, each with three types of omics data: microarray, RNA-Seq, and CNV. It’s worth noting that although COSMO was initially developed for transcriptomic and proteomic data, any gene-level quantitative data can be used as input in practice.
In the TCGA BRCA dataset, eight samples were reported to have mislabeled labels. After integrating the three types of omics data, COSMO accurately identified and corrected these eight mislabeled samples. In addition, COSMO also found eight previously undiscovered mislabeled samples, resulting in an overall mislabeling rate of 3.1% (16/521). After COSMO correction, there was a significant improvement in the consistency of gene expression between RNA-Seq and microarray data from the same samples in this dataset.
Upcomming omics modeling challenge
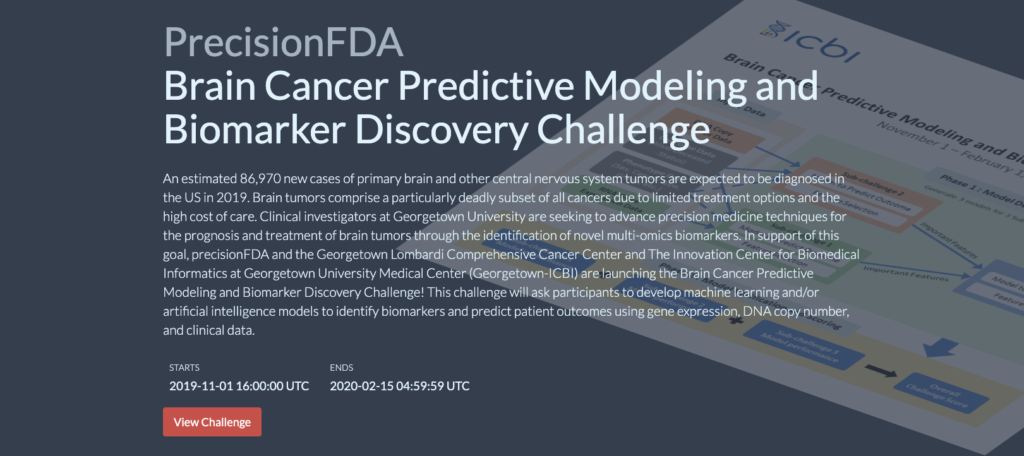
While the main goal of this challenge is sample label correction, its basic methodology relies on modeling multiple omics and clinical phenotype data to seek and establish connections between different data types. These machine learning modeling methods can be easily applied to predict clinical phenotypes through multiple omics data, thereby predicting disease progression or drug efficacy. In fact, precisionFDA held a new omics challenge in early 2020, seeking biomarkers for brain cancer prognosis by modeling and analyzing transcriptomics and CNV. The Sentieon team also participated in this competition, and we will provide further introduction after the competition results are released.
